Last night I walked into my apartment, tossed my keys, and asked the lights to dim. My phone, a silent partner in my pocket, handled the request before I even kicked off my shoes. In that instant I wondered: which gadget actually runs my life the most? I tracked every beep and blink for a week, compared notes with friends, and then dove into public data. The numbers surprised me, but the stories behind them mattered more.
Why “most-used” needs a clear definition
I learned that “use” can mean hours in hand, data consumed, or watts burned. Our answer changes if we measure touches, uptime, or energy.
Snapshot of 2025 household device habits
| A quick scan: | Device | Avg Active Hours/Day | Avg Energy (Wh/Day) |
|---|---|---|---|
| Smartphone | 4.2 | 12 | Hands-on time only |
| Wi-Fi Router | 24 | 40 | Silent workhorse |
| Smart TV | 3.1 | 80 | Streaming heavy |
| Laptop/PC | 5.0 | 150 | Work-from-home lift |
How this article will help you benchmark your own home
I will break down each category, share hard numbers, and show easy ways to log your own usage.
Curious which device steals the crown? Let’s define our rules before naming a winner.
Defining “Most Used” in a Modern Home
Hours vs. frequency vs. energy consumption
A phone might see hundreds of taps yet sip power. A fridge hums all day but rarely meets your eyes. Both matter, but in different scoreboards.
Active interaction versus passive background usage
Think of the smart speaker that hears every question. It waits, awake, while you sleep.
Routers, power strips, and cloud servers form the stage. They rarely get applause, yet the show stops without them.
A clear yardstick lets us judge each player fairly. Next, the gadget that lives in every pocket and often wins the popularity vote.
Smartphones – The Pocket Hub That Rules the Living Room
Global ownership and daily screen-time statistics
Ninety-one percent of adults in developed nations carry a smartphone. The average daily screen time hit 4.2 hours in 2024, and it shows no sign of falling.
| Region | Ownership % | Screen Time (hrs) |
|---|---|---|
| North America | 94 | 4.6 |
| Europe | 92 | 4.1 |
| Asia-Pacific | 89 | 4.3 |
Top activities done at home
- Streaming after dinner
- Endless messaging threads
- Quick IoT tweaks (“turn off the fan”)
Pros, cons, and emerging AI-centric features
Pros: portability, unified control, on-the-go work.
Cons: distraction loops, small screens, battery decay.
New frontier: on-device AI that drafts e-mails while you brew coffee.
Phones dominate eyeballs, yet they lean on quieter gear to stay useful. That brings us to the router humming beside the modem, never asking for glory.
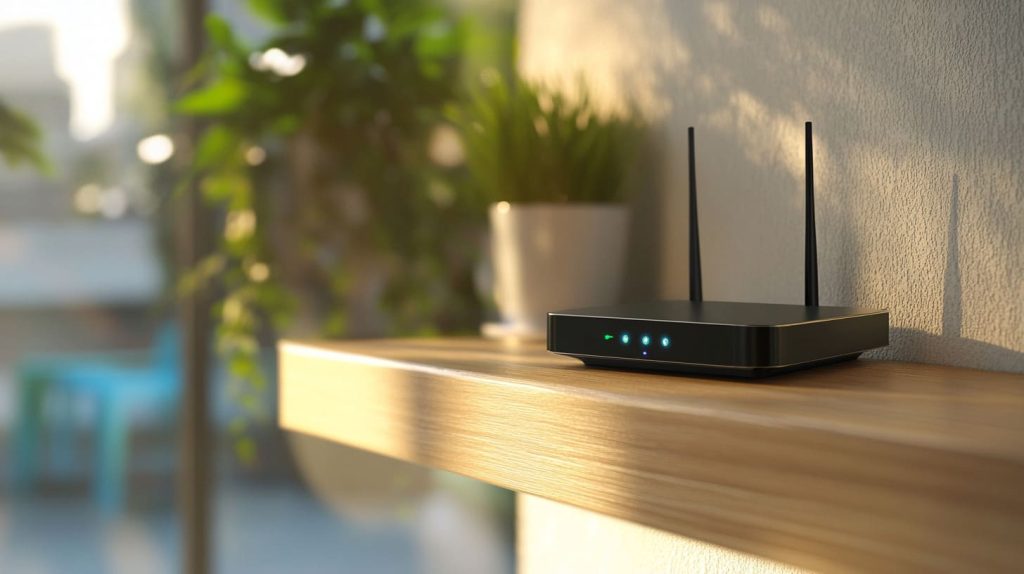
Wi-Fi Routers & Mesh Hubs – The Invisible Backbone
Why routers often log the highest uptime
They run 24/7 by design. A single reboot at dinner can spark household panic.
Bandwidth trends: 4K streaming, cloud gaming, smart appliances
Average home bandwidth demand doubled from 2020 to 2024. Cloud gaming spikes bandwidth by up to 40 Mbps per session.
Security and maintenance tips
- Change default admin passwords.
- Patch firmware twice a year.
- Schedule a weekly auto-reboot to clear cache.
The backbone stays out of sight until it wobbles. Still, nothing gathers the family like a bright TV on movie night, so let’s head there next.
Smart TVs & Streaming Sticks – The New Family Hearth
Cord-cutting data and viewing hours
More than 70 % of households ditched cable in favor of streaming. They watch an average of 3.1 hours nightly.
Built-in OS wars: Roku, Google TV, Tizen, and beyond
Each platform fights for a prime home screen. Roku pushes simplicity; Google TV leans on recommendation AI.
Energy draw and longevity considerations
Big screens can gulp 80 Wh per hour. Choose models with auto-dimming and 120 Hz only when you need it.
When my TV background light fades, I often call out, “Alexa, what time is it?” Let’s explore those ever-listening cylinders.
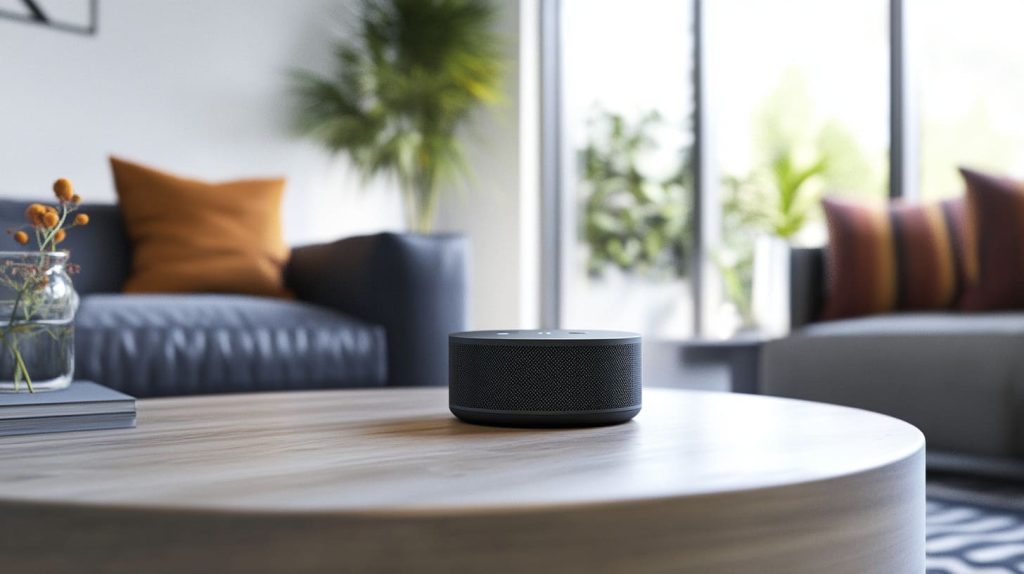
Voice Assistants & Smart Speakers
Adoption rates and multi-room audio trends
One in three homes has at least two smart speakers. Stereo pairing for casual music now ranks as a top use.
Everyday commands that drive usage spikes
Weather checks, timers, and shopping lists still lead. Short commands add up to real minutes saved.
Privacy concerns and best-practice settings
Mute the mic at night, delete voice logs weekly, and review third-party skills.
Speakers answer quick questions, but longer tasks pull me back to the keyboard. Let’s crack open laptops and desktops.
Laptops & Desktop PCs – Still Essential for Work and Creation

Work-from-home impact on active PC hours
Remote work pushed average daily PC use over five hours. Video calls alone account for 45 minutes.
Content creation, gaming, and heavy-lift scenarios
From CAD designs to AAA games, desktops still own raw power.
Upgradability and ergonomics
Swap RAM in minutes, fine-tune desk height, add a second monitor—your wrists and eyes will thank you.
Yet many chores run quietly in the background. Enter the smart plugs and sensors that never sleep.
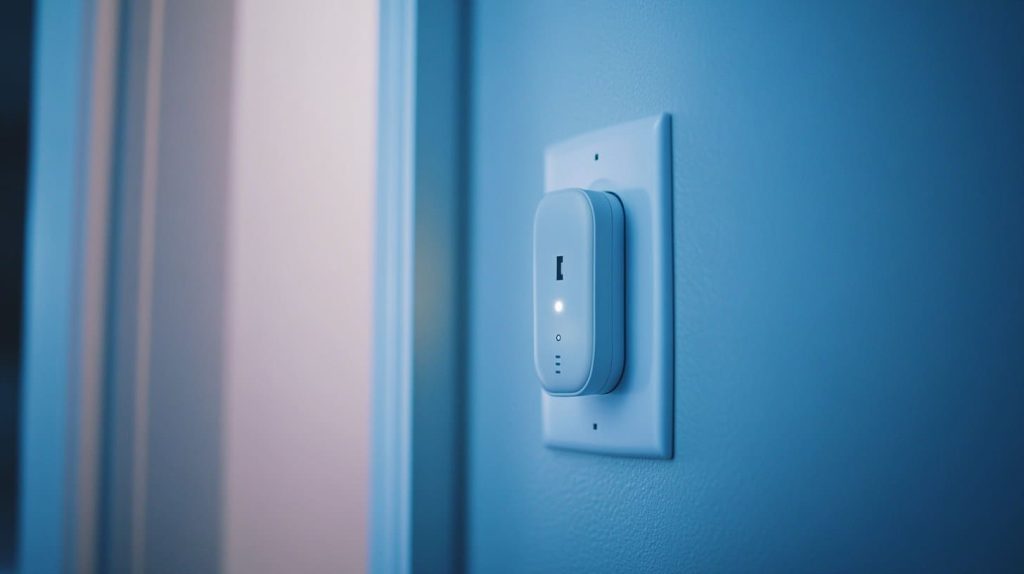
Emerging “Quiet” Champions: Smart Appliances & Sensors
Thermostats, plugs, lights, and the growing IoT footprint
A home may host 30+ connected nodes, each sipping power yet talking all day.
How background cycles add up
Power-strip sensors ping every 30 seconds. Multiply that by 24 hours and the data pile grows fast.
Standards convergence
Matter and Thread finally promise common language, trimming setup pain.
A thermostat’s silent data flow sets the stage for devices not yet mainstream. Future toys may upset our rankings entirely.
Future Contenders: Wearables, AR/VR Headsets, and Home Robots

Usage projections for the next five years
Analysts see AR glasses nudging two hours daily by 2030, mostly for heads-up tasks.
Hardware challenges
Battery density, heat, and network lag still block marathon sessions.
Opportunities for modular, customizable casings
As plastics give way to lightweight alloys, firms like mine can craft snap-on shields that cool chips and flaunt your logo.
To judge today’s winners you need good data from your own living room. Here’s a quick DIY approach.
Measuring Your Own Device Footprint
Built-in screen-time dashboards and app analytics
Most phones now ship with detailed digital wellbeing panels.
Home energy monitors and smart plugs
Clamp meters and smart outlets show real-time watts.
| Tool | Cost | Data Granularity |
|---|---|---|
| Smart Plug | \$15 | per outlet |
| Whole-home Clamp | \$60 | per circuit |
Creating a simple Raspberry Pi log server
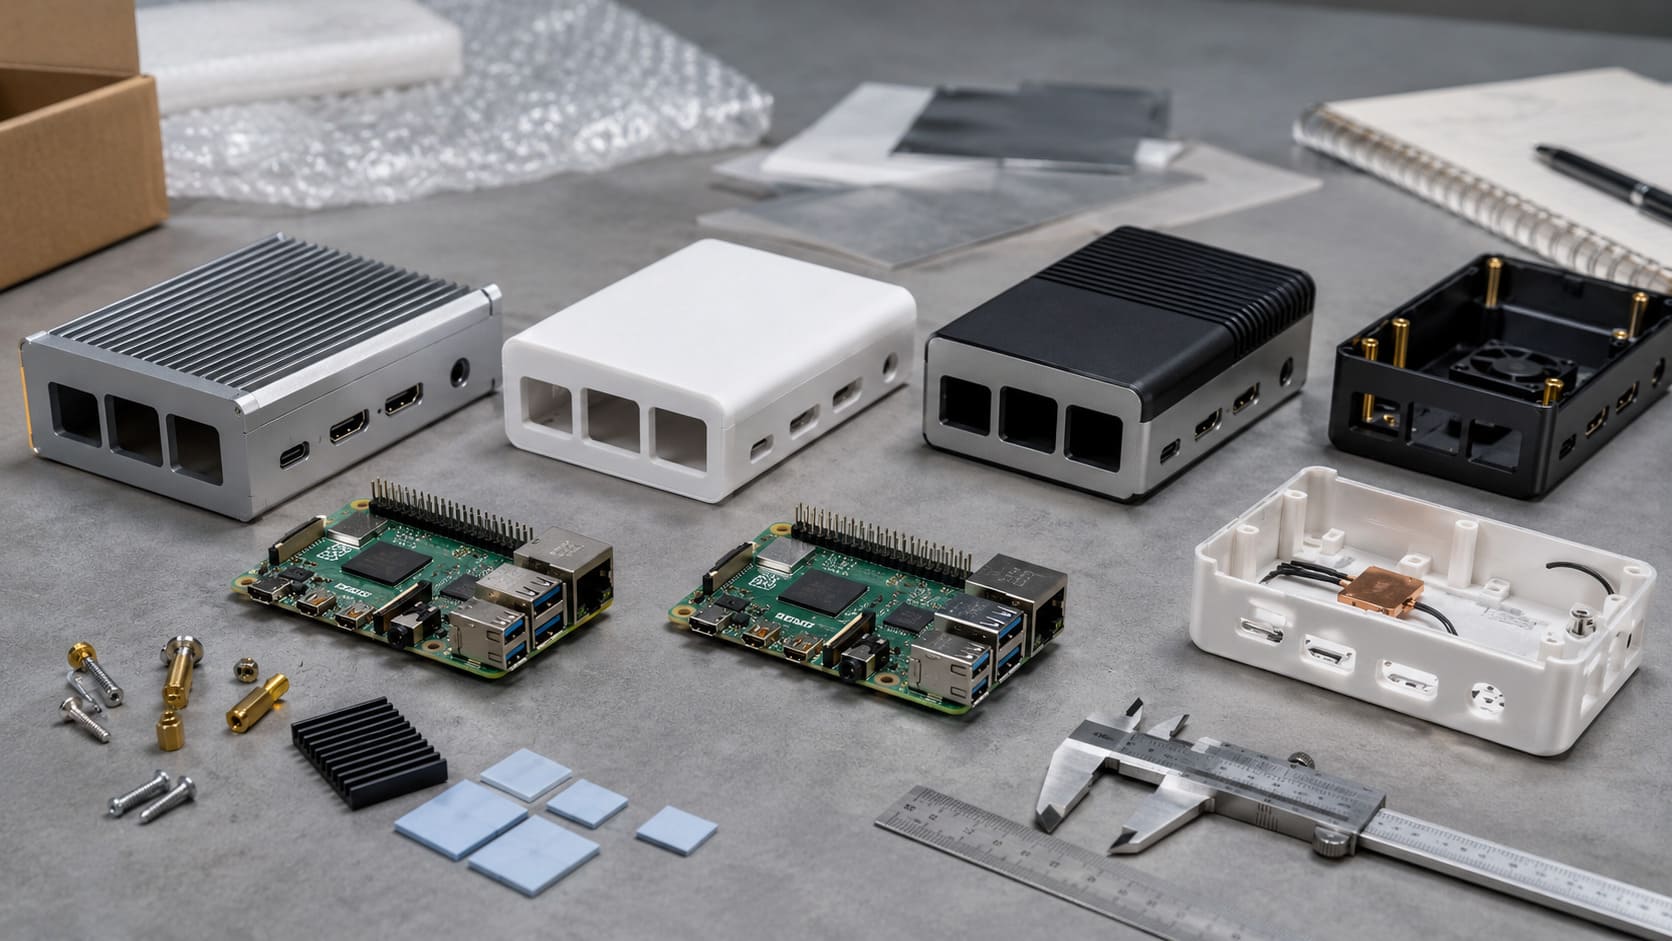
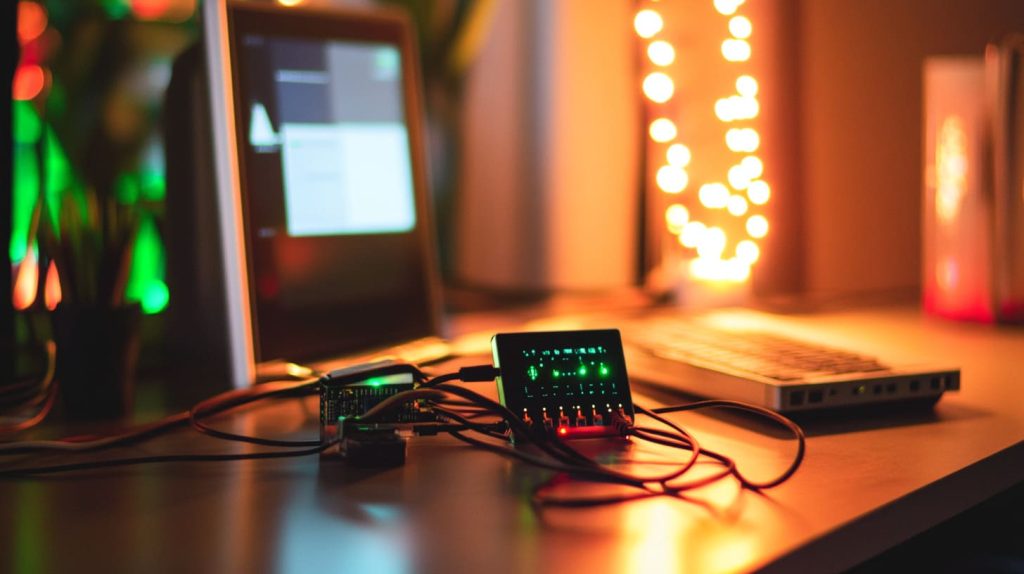
I flash a Pi Zero, install Grafana, and capture router traffic. In one weekend you can map every byte your home burns.
Now, a note for fellow makers and resellers curious about cases that survive heavy use.
Business Insight: Custom Enclosures for High-Usage Electronics
Why heavy-use devices benefit from specialized cases
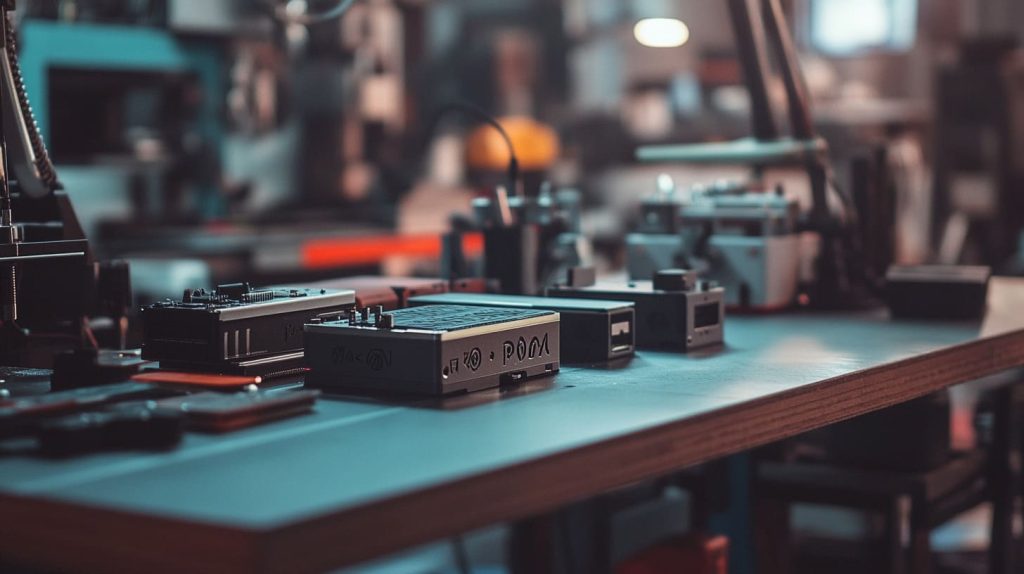
Heat, dust, and constant handling shorten lifespan. A tailored shell adds airflow, branding, and drop resistance.
MaidaTech solutions: branding, thermal design, rapid OEM/ODM
With three lines and CNC routers, we cut polycarbonate days faster than competitors and stamp your logo in one pass.
Case studies
Davide from Belgium cut returns by 12 % after switching to our vented Pi cases. Lasle in Hungary shipped a redesigned hub ahead of schedule thanks to quick prototype swaps.
Conclusion
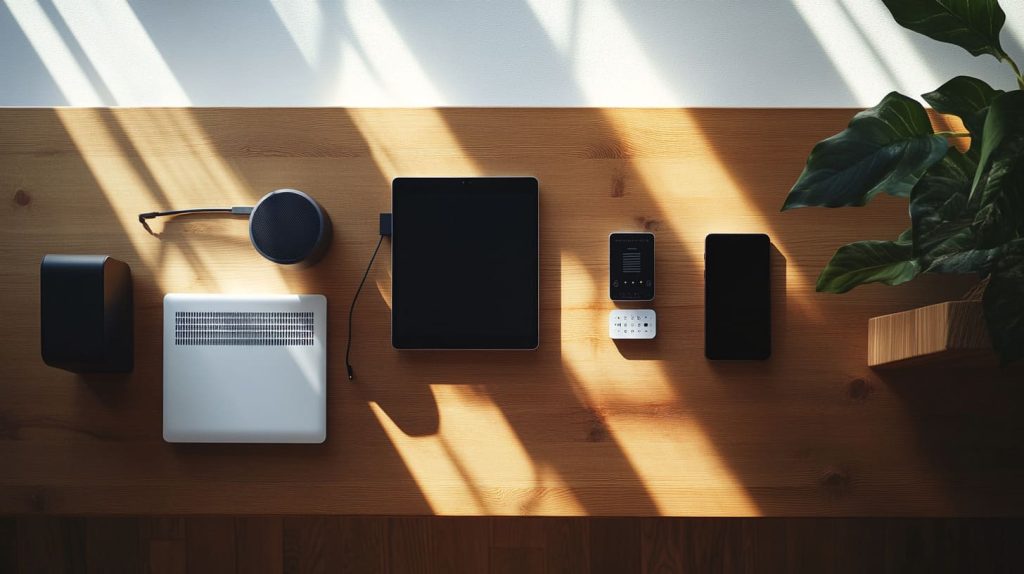
Phones grab the spotlight, routers shoulder the load, and TVs still gather people after dinner. Yet the true “most-used” device changes with the yardstick you pick—time, energy, or data. Track your house for a week, tighten security, and pick cases that keep hardware cool and branded. The way you measure today will shape the devices you buy tomorrow.